Spectral Mirror display
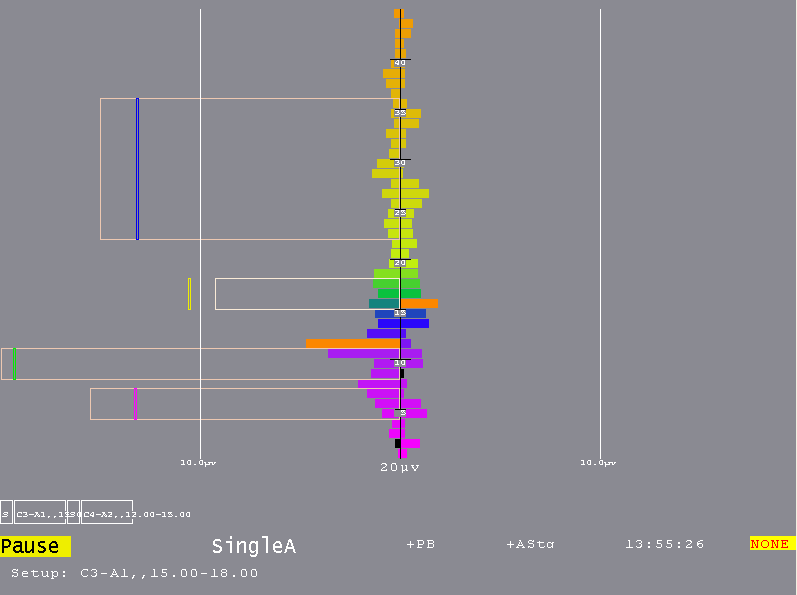
The Spectral Mirror display shown below displays the same spectral data as the FFT bars but in a different format. The D Therapist Display Control popup allows control over the scale for this display. The A channel is on the left and B channel on the right when A&B is selected as the display mode. Otherwise, a single channel is mirrored on left and right.
Notice that the filter bands are shown with a threshold value as the edge of the outline and the current average amplitude is shown as a vertical colored bar at the appropriate position. The orange bars are the dominant frequency markers.