
Review
Review
The Review button brings up the session review screens for post-session analysis. A typical screen is shown. The top portion has a number of different display formats (graph, summary, bar, and details). Shown is the Graph format with a single session's data shown in graphical format.

To the right of the graph are two sliders for controlling the scale and smoothing of the graphical data. Just below the graph are some checkboxes and buttons controlling the display at the top of this screen.
The graph shows each stream plotted as amplitude versus time (in minutes). The colors are the frequency-specific colors used throughout EEGer unless changed by a user option (discussed below). The short vertical black lines mark the beginning/ending of periods. Non-feedback times (paused or resting) are shown by the gray shading between period lines. Short red lines mark the time-location of significant events such as frequency changes, user F8 marks, etc. Threshold change events and scale change events can optionally be shown if the respective checkboxes are checked. These checkboxes also control whether threshold/scale changes appear in the details data.
The top scale slider allows selection of a voltage scale for the session graph (or 0 for autoscaling). The smoothing slider allows control of data smoothing for graphical display. The value 4 represents 16-second smoothing and the value 5 represents 32-second smoothing. The value 0 is no smoothing.
The bottom graph is a trend graph of sessions. The colors of the lines are the frequency-specific colors used throughout EEGer. To the right of the trend graph is a list of all the sites used in the displayed sessions. To the right of the list is a scale slider allowing selection of a voltage scale for the trend graph (or 0 for autoscaling). At the right edge are some buttons and checkboxes allowing various options. The options available are shown here:
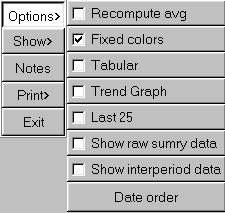
The Show choices available are:
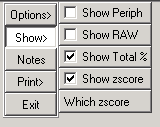
If there is zscore data embedded in the data file, the additional button choices for display after clicking on Which zscore are:

The Notes button brings up the embedded editor with notes for the current client. F8 can also be used to start/end the editor function. The Print button options will be either

if print direct is selected or

if the save -for-later-printing option is selected (NOT print direct).
By default, the raw data streams are not shown. Clicking on the Show Raw checkbox toggles display of the raw data streams. On the top graph, raw data is shown with a black color. On the bottom graph, raw data is shown with a color representing the lowpass filter width.

In some cases, it is hard to see/print the colors or to determine which stream is which if the frequencies (colors) are similar. The Fixed colors checkbox toggles between frequency-specific colors and a fixed set of colors that is independent of frequency.

The above screen shows the summary data (text) for the currently-selected session. Clicking on one of the sites listed in the site list produces a gray shading (in the trend graph)for the periods where the selected site was used (shown in the next screen).
The average values shown above are the average values at the end of the period. Checking the "Recompute avg" checkbox produces the same display except that the average values are recomputed to be the average value across the entire period rather than just the ending values.
The Summary screen shows the summary data (text) for the currently-selected session.
The average values shown above are the average values at the end of the period. Checking the "Recompute avg" checkbox produces the same display except that the average values are recomputed to be the average values across the entire period rather than just the ending values.

Above is the same screen with the raw data option checked (to show channels A and B) and with the interperiod data shown. The interperiod data is the average value and standard deviation of the time BETWEEN feedback periods.
The Bar screen shows a barchart representation of the time (red bars) and scores (frequency specific color at end of period) for the selected session's periods.

The Details screen is shown in the following image . This is a chronological list of significant events during the selected session. Note that the threshold and scale checkboxes were selected so that threshold and scale adjustments were reported. The time of the threshold/scale adjustment is the time at the beginning of the adjustment and the value at the end of the adjustment (10 seconds without change).

Note that the Scale and Threshold event checkboxes cause additional data to be displayed even on the graph display (as red lines at the appropriate time point).

If there are many sessions, the Tabular checkbox allows display of all the sessions for the current client. Double-clicking on a line causes that session to be displayed in the top area.

The Trend checkbutton controls whether or not the trend graph is shown on the bottom graph.

Whenever the mouse cursor is moved over the top graph area, the text display at the top represents the state at that (horizontal) time.

If the TOTAL % checkbox is selected, the total reward percentage will be shown on the graph as a bold green line.

If peripheral data exists in the summary file, the Show Periph button controls the display of the data. The scale and graph line are drawn in a forest green color.

The Zscore screen shows one or more measures as selected by the "which zscore" buttons. The green buttons determine which zscore measures are selected. The blue buttons determine which frequency bands are selected.

The displayed measure is always shown in the title of the graph. Above is shown zscore coherence in the 1-4 Hz band. Below is shown all measures in the 4-8 Hz band.

Below is a single zscore measure (coherence) for all bands.

For completeness, you can also show all measures for all bands. It is pretty to look at but not of much use.

The Proto screen shows the (textual) values of the selected sessions (all or last 25) for the current client. This data is sorted by session date (Date order), frequency settings (Freq order), or reward frequency (Reward Freq order) as selected by the Option selection. Each group is comprised of like layouts, sites, feedback modes, and eyes open/closed status. Each line has the date of the session, the length (in minutes), and the frequency range/ending value/percent change for each band. The percent value will be 0 or 100 if the beginning value was zero (based on the ending value...).

The Save Summary print button causes two files to be created with the graph display in one and the summary data in the second for later printing (using the Print menu option). If the button says Print Summary, the two printouts will be directed immediately to the default Windows printer. If the option for a single page is select in the Preferences configuration menu, both printouts will be combined into a single file/printout page. Selection of the button actions is made in the Configuration->Preferences tab.
The Save Details print button causes a file to be created with the currently-selected options (threshold, scale actions) for later printing. If the button says Print Details, the printout will be directed immediately to the default Windows printer.
The Save Trend print button causes a file to be created with the trend graph display. If the button says Print Trend, the trend graph will be directed immediately to the default Windows printer.
The Save Protocol print button causes a file to be created with the protocol summary data (as currently ordered). If the button says Print Protocol, the printout will be directed immediately to the default Windows printer. Please note that the line wrapping can make the output hard to interpret. It may be better to use the Save Protocol mode and view the print file stored in the Print folder in some external program.
The Exit button returns to the top menu.