Spectral
Spectral
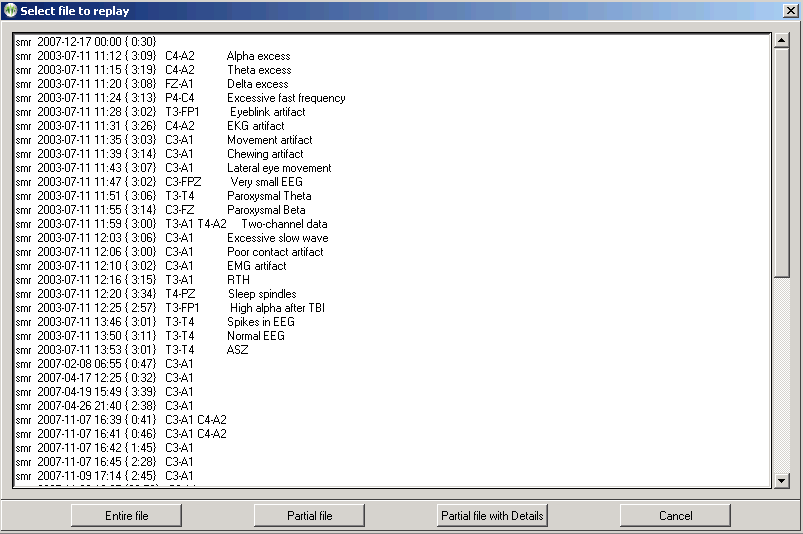
Clicking on the Spectral button brings up a raw file selection screen.
Once the file is selected, the graphical display of the data is begun. A typical screen looks like this:
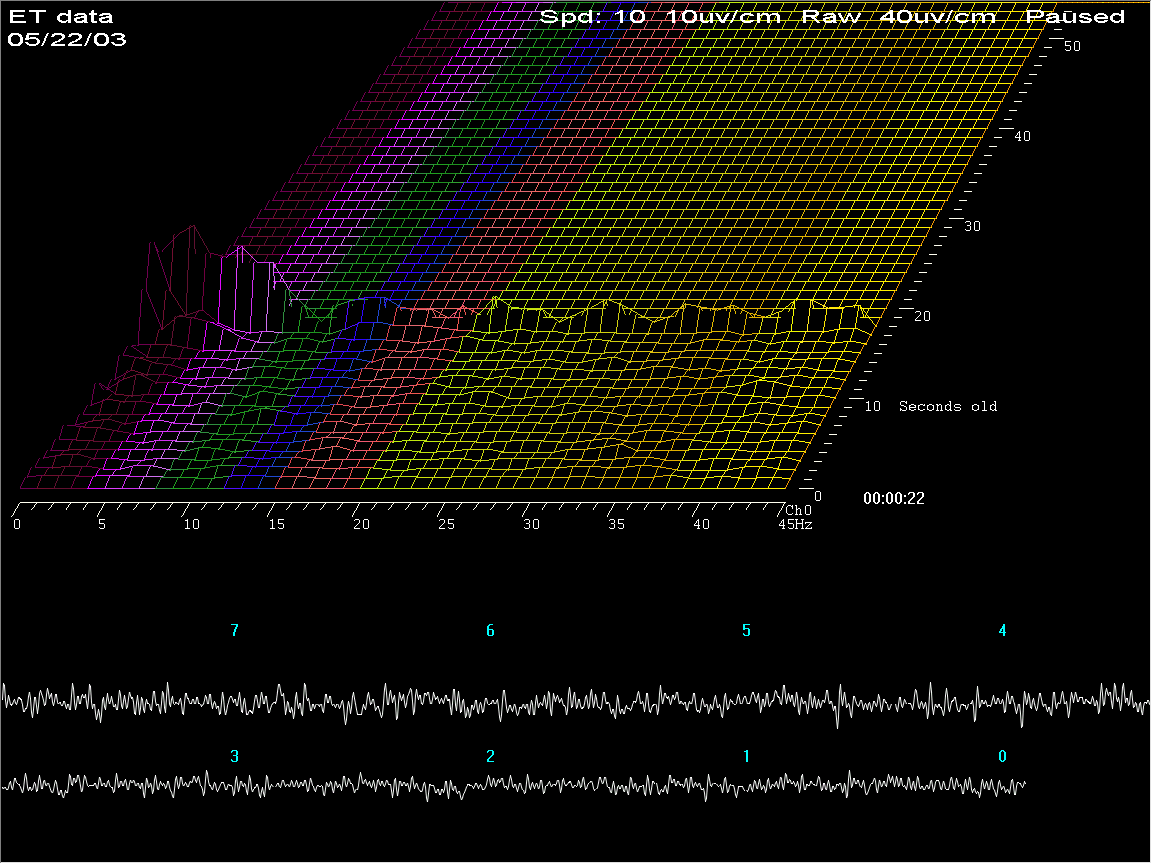
The top part of the screen shows spectral (FFT) data as a three-dimensional plot of frequency (horizontal), time (perspective), and amplitude (vertical). The coloration of the frequency bands uses the customizable color scheme used throughout EEGer. The bottom part of the screen shows the raw signal corresponding to the spectral data. The legends on the raw data show how many seconds "old" the raw data is. The "newest" raw data corresponds to the front-most spectral display row.
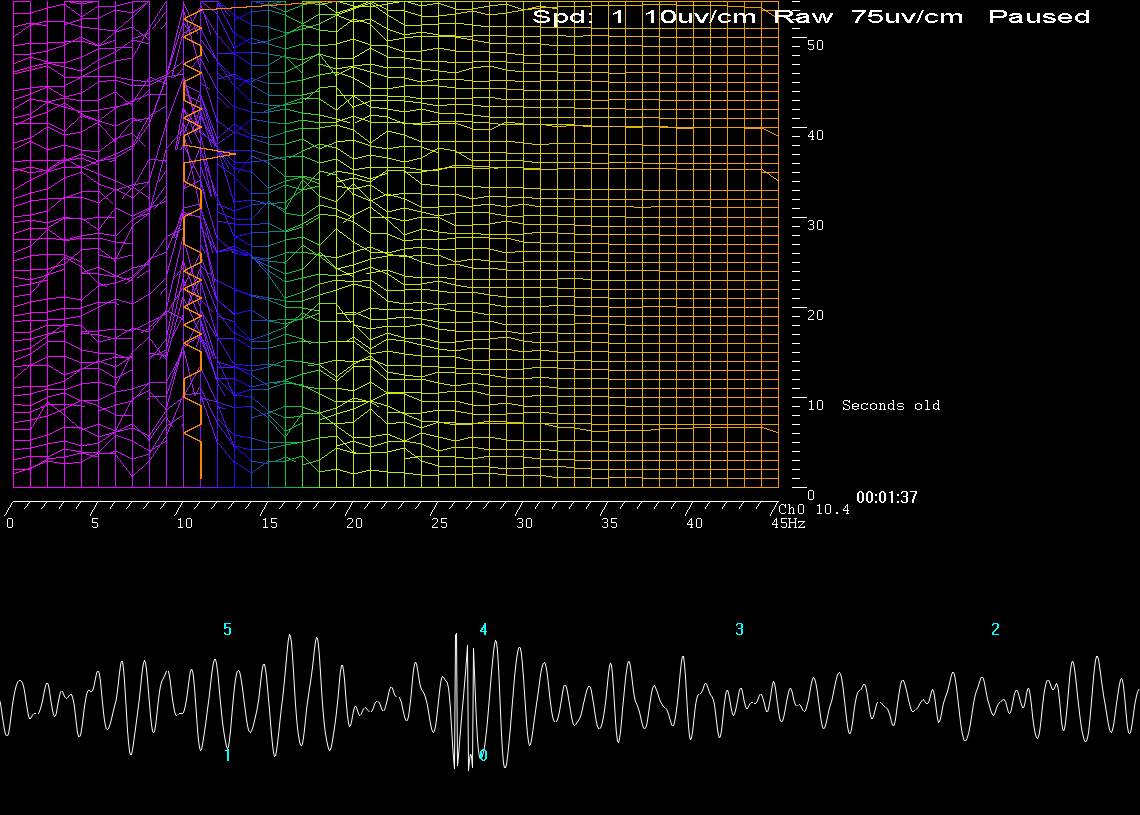
This is the screen with the time axis shown vertically (by moving the viewing angle left) and the dominant frequency marker turned on. Notice the 10-second average dominant frequency value shown to the immediate right of the channel assignment value.
Pressing F1 brings up a help menu showing the key options available.
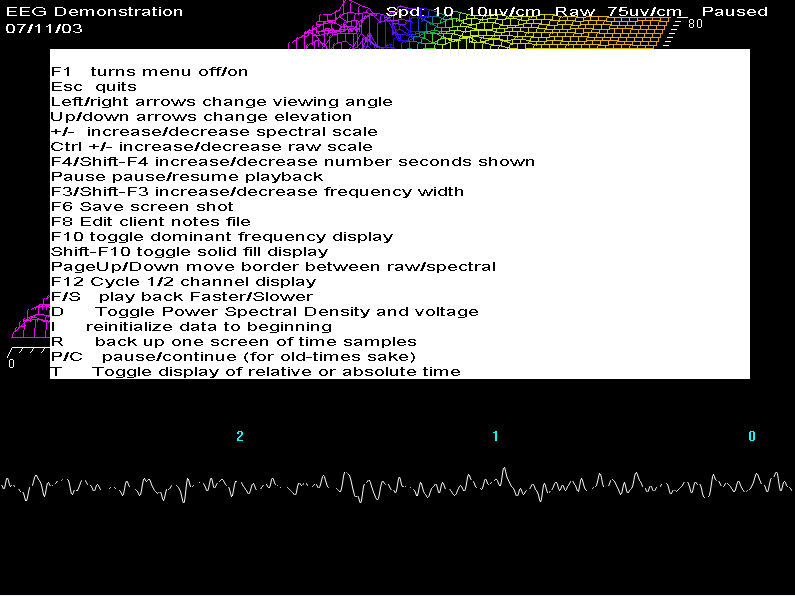
F1 toggles the help screen off/on.
Esc terminates the spectral replay and returns to the top menu.
left/right arrows change the viewing angle by moving the apparent vanishing point left/right.
up/down arrows change the apparent elevation angle by moving the apparent vanishing point up/down.
+/- change the relative spectral scale.
Ctrl +/- change the relative raw data scale.
F4/Shift-F4 increases/decreases the "number of seconds" of data shown (apparent depth of display).
Pause pauses/resumes playback of data.
F3/Shift-F3 increases/decreases the displayed number of frequency bins.
The computation always uses a 1 Hz bandwidth but the clinician may only be interested in the lower 10 Hz.
F6 saves a screen for later printing. Black and white are reversed in the print file.
F8 Edit client notes file
F10 Toggles display of dominant frequency line (which uses color 49 of the current color set.
Shift-F10 Toggles display of solid color fill.
Page-Up/ Page-Down moves the border between the raw and spectral data.
F12 changes the display between two-channel/channel A only/channel B only modes.
F/S make the playback be faster/slower than real time.
D Toggles between voltage amplitude on spectral display and Power Spectral Density display (voltage squared).
PSD tends to show changes more dramatically.
I pauses playback and rewinds the data point back to the beginning.
R pauses playback and backs up one "number of seconds" worth of data.
P/C pauses/continues playback.
T Toggle time display between time-of-day and relative time in session.
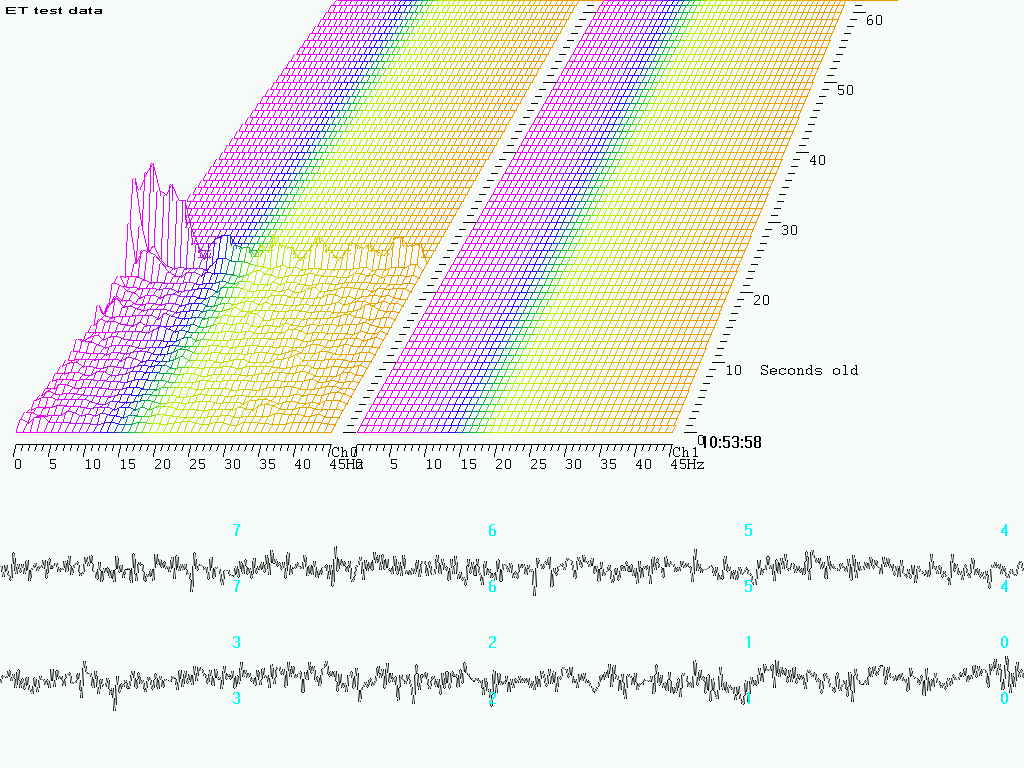
This is what a two-channel screen display looks like (after pressing F12 several times).
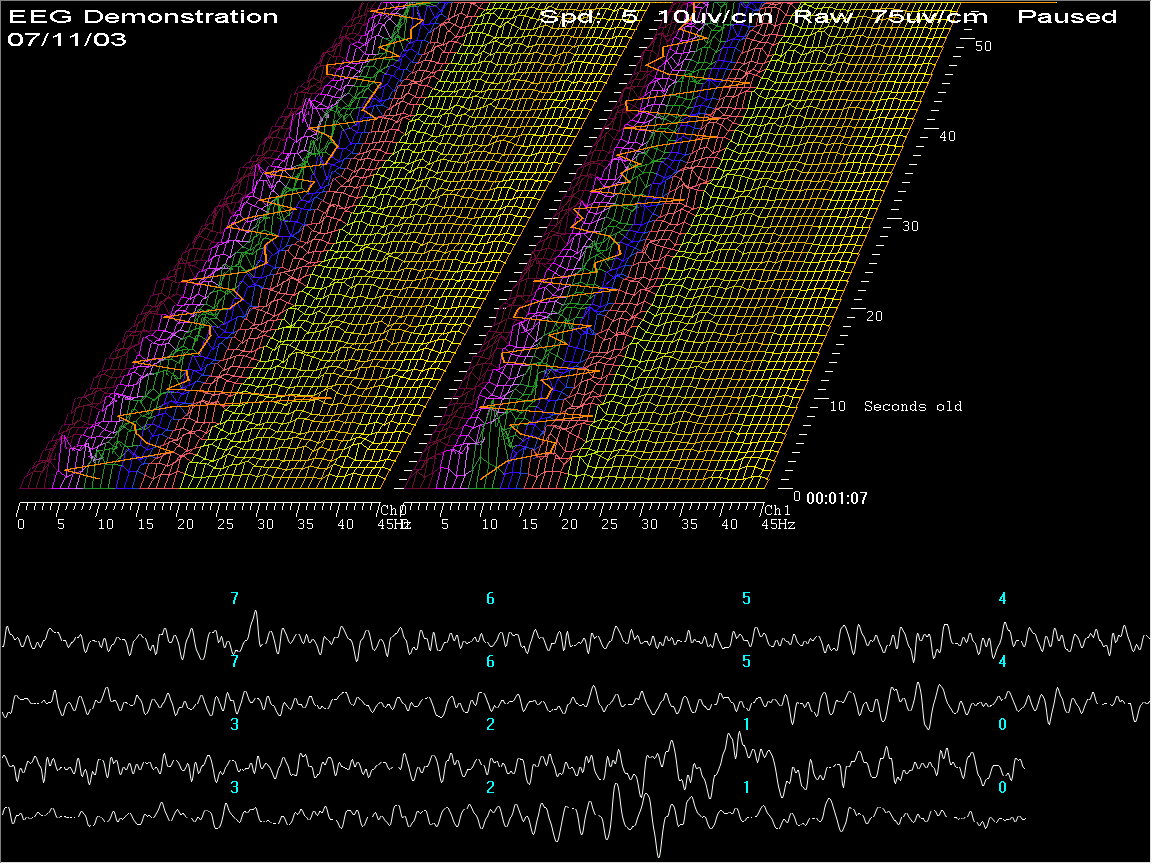
Note that the dominant frequency display marker is turned on (using F10).
Pressing F6 causes a printout to be saved with black and white reversed (to save printer ink).