Long-term display
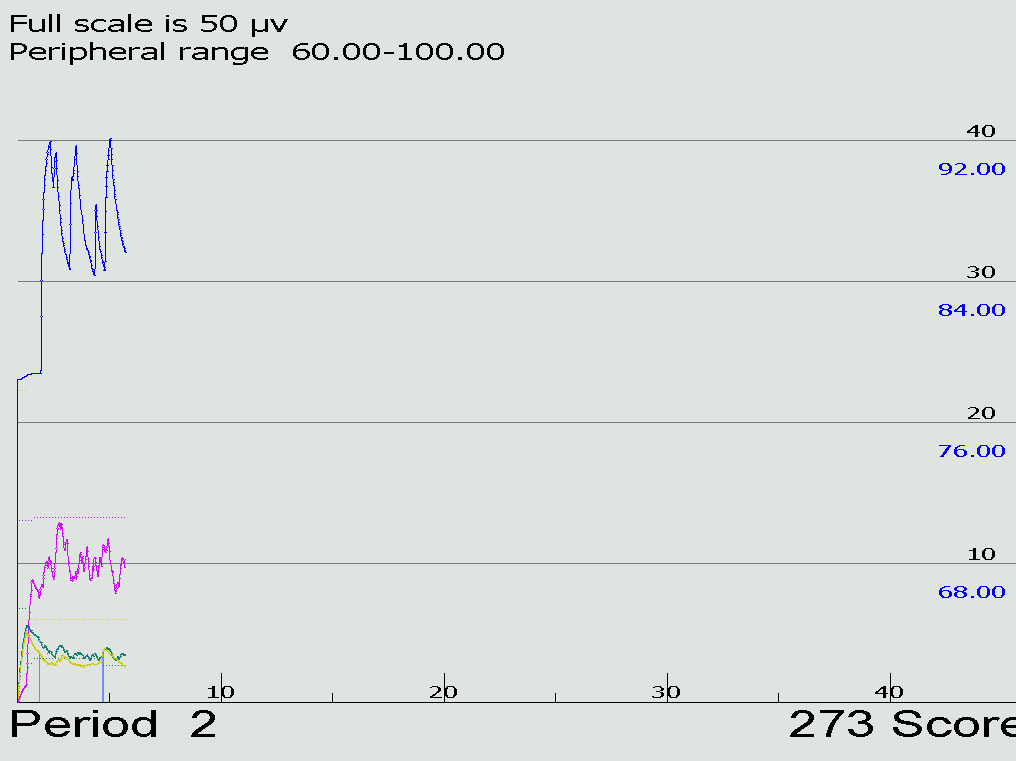
The long-term display shows either or both of EEG data and peripheral data
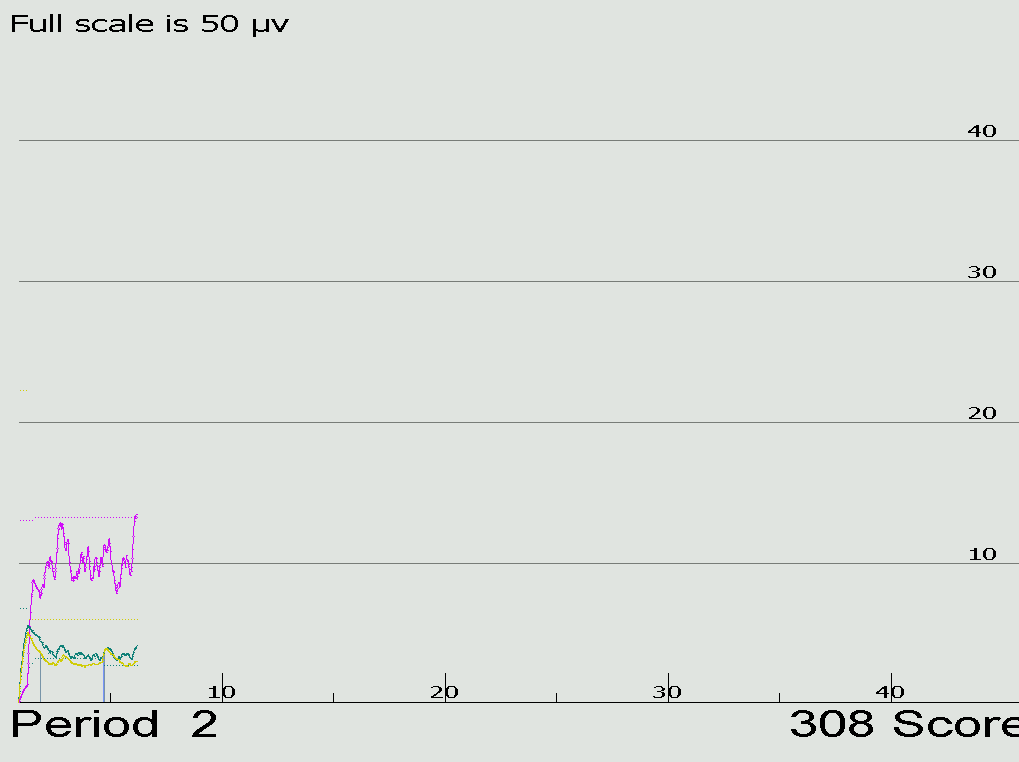
The display above shows both kinds of data in the slow display mode where the entire session width represents the screen width (as shown on the time scale at the bottom). There are different scales for peripheral and EEG data. Below is shown the display with no peripheral data displayed. Notice that the frequency bands are shown with the related color code.
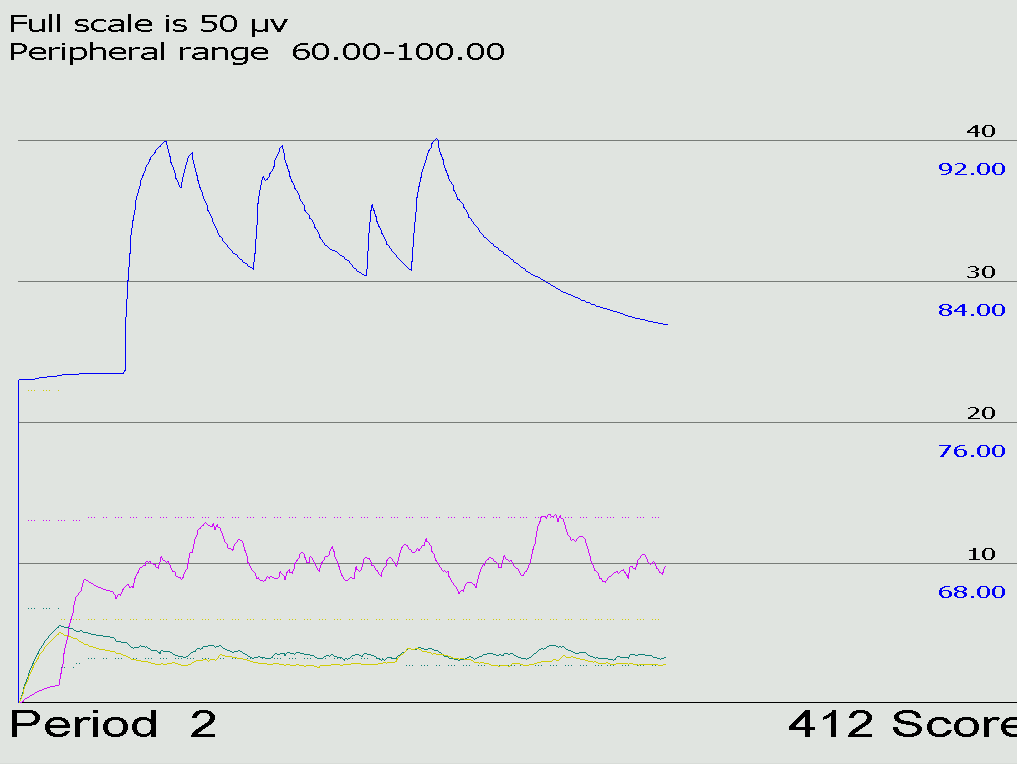
Here is the display shown using the medium speed display (10 minutes across):
The EEG threshold line displays are also controllable by the therapist.